Challenge
Our client is using GiveWP to create and manage regular giving subscriptions. Each subscription is linked to a specific fund.
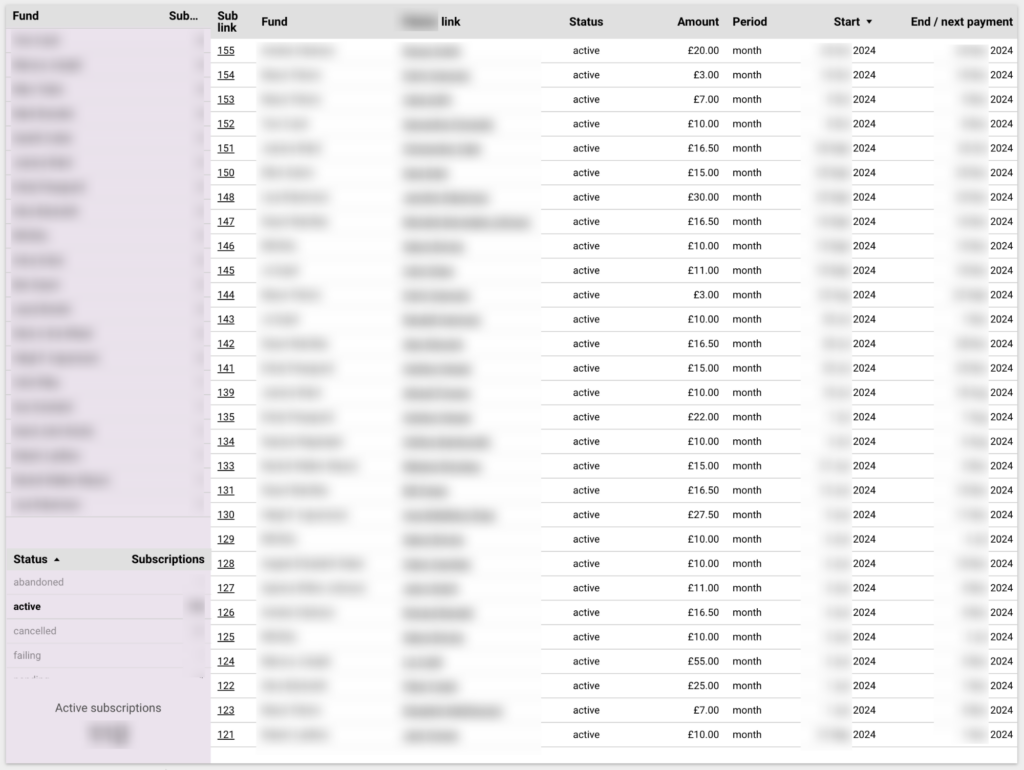
We needed a way to quickly view and analyse the active subscriptions, including:
- Total number of active subscriptions.
- Distribution of subscriptions across the different funds.
- Current monthly amount of each subscription.
- Start and end / next renewal dates.
GiveWP includes some reports, but as is often the case with reporting, these didn’t quite meet our client’s needs.
This meant the client had to look in several places to get the summary information they needed, and had to rely on manual analyses to produce aggregated data.
Implementation
We utilised the excellent reporting capabilities of Looker Studio to produce clear dashboards of the key data points for this client.
Data from GiveWP is loaded into Google Sheets on a daily basis, automatically. This provides the datasource to Looker Studio.
A custom extension to the WordPress API was developed to make the relevant GiveWP data available to Google Sheets.
Results
The client now has a clean, easy-to-use dashboard that provides exactly the at-a-glance data they require:

Interactive
Using Looker Studio’s cross-filtering capabilities, the data can be filtered by fund and/or subscription status by simply clicking the relevant values.
Data can be easily sorted by clicking the relevant column headers.
The ‘sub link’ column provides direct links to the subscriptions within GiveWP. This makes it super simple to dive straight into the relevant source data if further context is needed.
Sharable
The live dashboard can be shared with relevant stakeholders using the Looker Studio’s sharing settings.
This removes the need to produce manual one-time summary reports, saving valuable time of senior personnel.